|

|
|
|
|
|
|
|
|
|
|
|
|
|
|
|
Strategic
decisions & Working Capital (WC)
|
|
|
|
|
|
|
Investment
decisions |
|
|
Modes of diversification
: |
|
|
Inter-Organizational relationships
: |
|
|
|
|
|
Others : |
|
|
|
|
|
Long-Term
Financial decisions |
|
|
|
|
|
|
|
Investment
analysis and decision |
|
|
|
|
|
|
|
|
|
|
|
|
|
|
Rank |
Years |
SMI ® |
Annual |
1 |
1990 |
1 383,1 |
variations |
2 |
1991 |
1 670,1 |
20,75% |
3 |
1992 |
2 107,0 |
26,16% |
4 |
1993 |
2 957,6 |
40,37% |
5 |
1994 |
2 628,8 |
-11,12% |
6 |
1995 |
3 297,7 |
25,45% |
7 |
1996 |
3 942,2 |
19,54% |
8 |
1997 |
6 265,5 |
58,93% |
9 |
1998 |
7 160,7 |
14,29% |
10 |
1999 |
7 570,1 |
5,72% |
11 |
2000 |
8 135,4 |
7,47% |
12 |
2001 |
6 417,8 |
-21,11% |
13 |
2002 |
4 630,8 |
-27,84% |
14 |
2003 |
5 487,8 |
18,51% |
15 |
2004 |
5 693,2 |
3,74% |
16 |
2005 |
7 583,9 |
33,21% |
17 |
2006 |
8 785,7 |
15,85% |
18 |
2007 |
8 484,5 |
-3,43% |
19 |
2008 |
5 534,5 |
-34,77% |
20 |
2009 |
6 545,9 |
18,27% |
21 |
2010 |
6 436,0 |
-1,68% |
22 |
2011 |
5 936,2 |
-7,77% |
23 |
2012 |
6 822,4 |
14,93% |
24 |
2013 |
8 203,0 |
20,24% |
25 |
2014 |
8 983,0 |
9,51% |
26 |
2015 |
8 818,1 |
-1,84% |
27 |
2016 |
8 219,9 |
-6,78% |
28 |
2017 |
9 381,9 |
14,14% |
29 |
2018 |
8 429,3 |
-10,15% |
30 |
2019 |
10 616,9 |
25,95% |
31 |
2020 |
10 703,5 |
0,82% |
32 |
2021 |
12 875,7 |
20,29% |
33 |
2022 |
10 729,4 |
-16,67% |
34 |
2023 |
11 137,8 |
3,81% |
35 |
2024 |
11 600,9 |
4,16% |
|
|
R m |
8,204% |
|
|
STD |
19,38% |
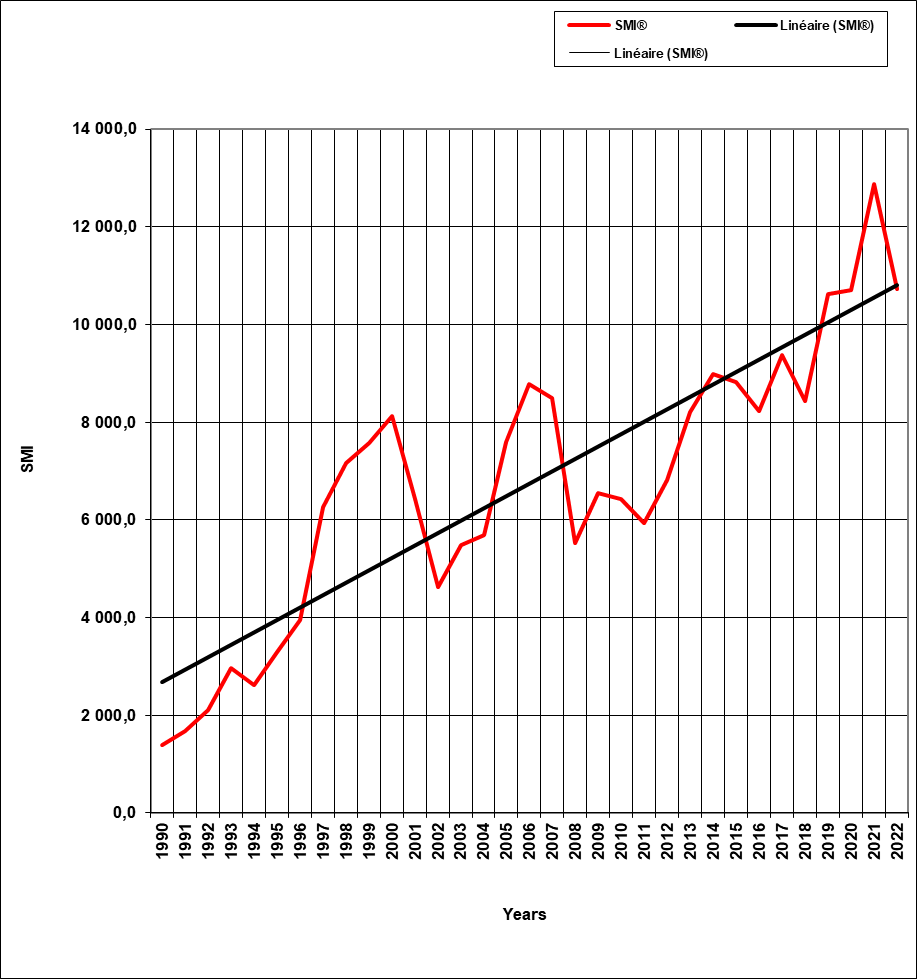
| Return on the market 1990 - 2024 |
8,204% |
| Risk free rate (Bond rate of Federal State - 10 years - Dec 2024) : |
0,317% |
| Risk premium of the market |
7,887% |
Note
: The market
must be looked on a long term point of view.
The Return on market depends on the period
you choose
|
Rm (SMI) |
| 1990-2024 |
7,82% |
| 1991-2000 |
20,76% |
| 1996-2024 |
6,11% |
| 1999-2024 |
3,25% |
| 2000-2024 |
3,15% |
| 2000-2004 |
-3,85% |
© Bernard Jaquier, Professor Emeritus & Dr Honoris Causa, Lausanne, Switzerland, 2025
|
|
|